

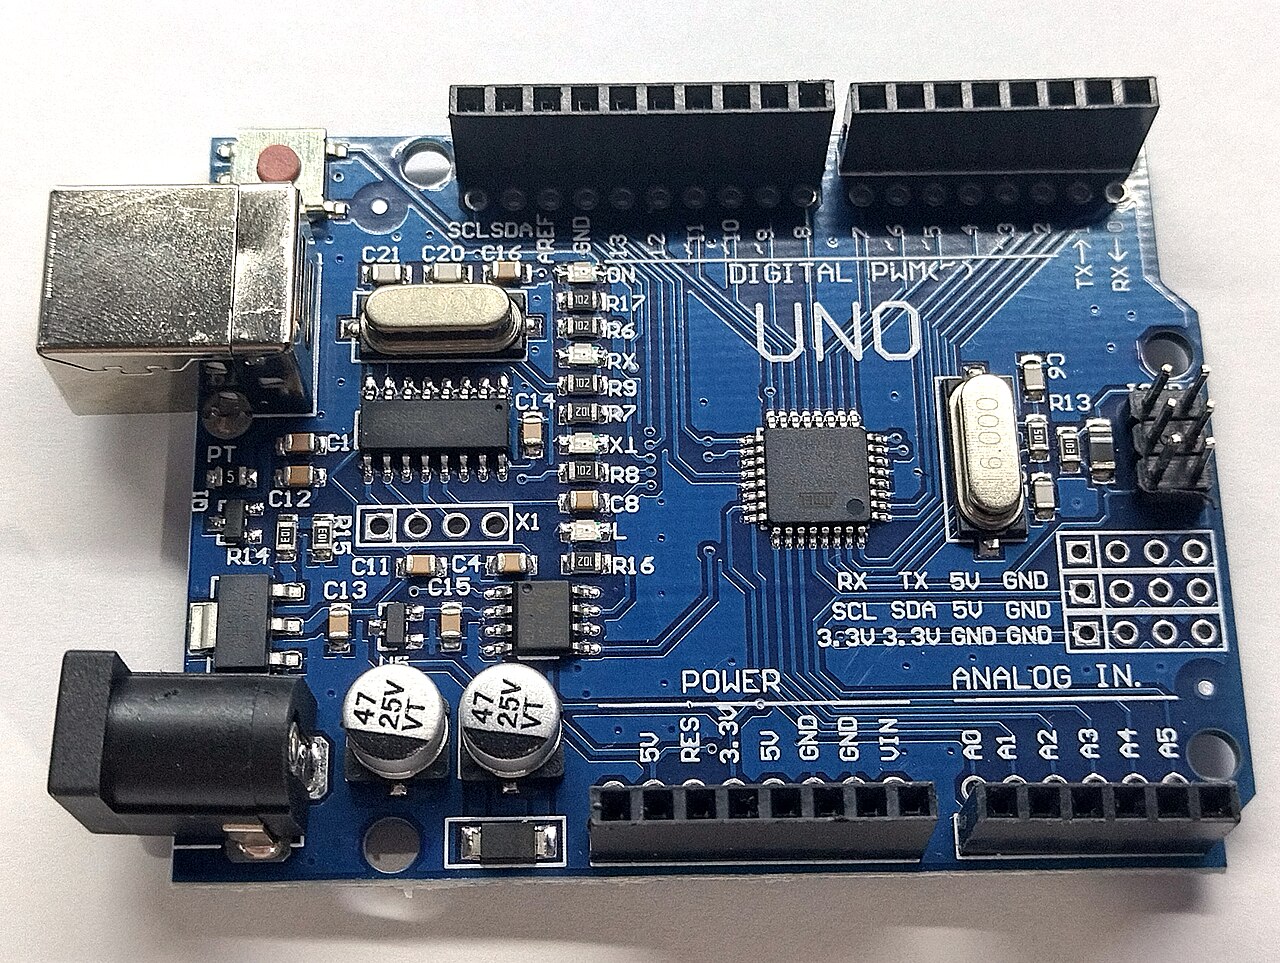
The probe hardware runs on Arduino-compatible microcontrollers. Firmware: commonly called a sketch: reads sensors on a timer, formats the results as JSON, and serves them over the network so the website and other clients can fetch live data without serial cables.
Sketch responsibilities
- Initialize sensor buses and the local 16×2 LCD for on-site readouts.
- Read each DHT22 probe with retry logic for transient bus errors.
- Compute an average across healthy probes for a quick summary value in JSON.
- Respond to HTTP requests with a compact JSON document via the Ethernet shield.
- Optionally log errors to serial for on-site debugging.
Typical JSON shape
Consumers expect a top-level temp object with numeric keys for each probe plus
avg. Humidity appears alongside temperature per probe. Keeping keys stable matters
more than pretty printing: dashboard mappings reference those keys directly.
{
  "temp": {
    "0": { "f": 38.2, "c": 3.4, "h": 41.0 },
    "1": { "f": 36.8, "c": 2.7, "h": 43.5 },
    "avg": { "f": 37.5, "c": 3.1, "h": 42.2 }
  }
}
For push ingest, the same probe object can be
posted to /api/ingest/<key>. Optional top-level battery (or
battery_pct) and rssi fields update device health on the Devices page without
requiring extra sensor keys.
{
  "temp": {
    "0": { "f": 38.2, "c": 3.4, "h": 41.0 }
  },
  "battery": 87,
  "rssi": -62
}
Push ingest from the Ethernet shield
The W5100 stack on an Uno cannot TLS, so it cannot POST directly to
https://probeharbor.dev. Use
ethernet_dht22_ingest
to POST the classic temp JSON over HTTP (DHT22 on A4/A5, optional JSON on port 80 for
LAN pull). Run
push_https_forward.py
on a Pi, NAS, or laptop so those POSTs reach ProbeHarbor over HTTPS. ESP32 Wi‑Fi samples that speak
TLS live in
sketches/.
Hardware wiring guides
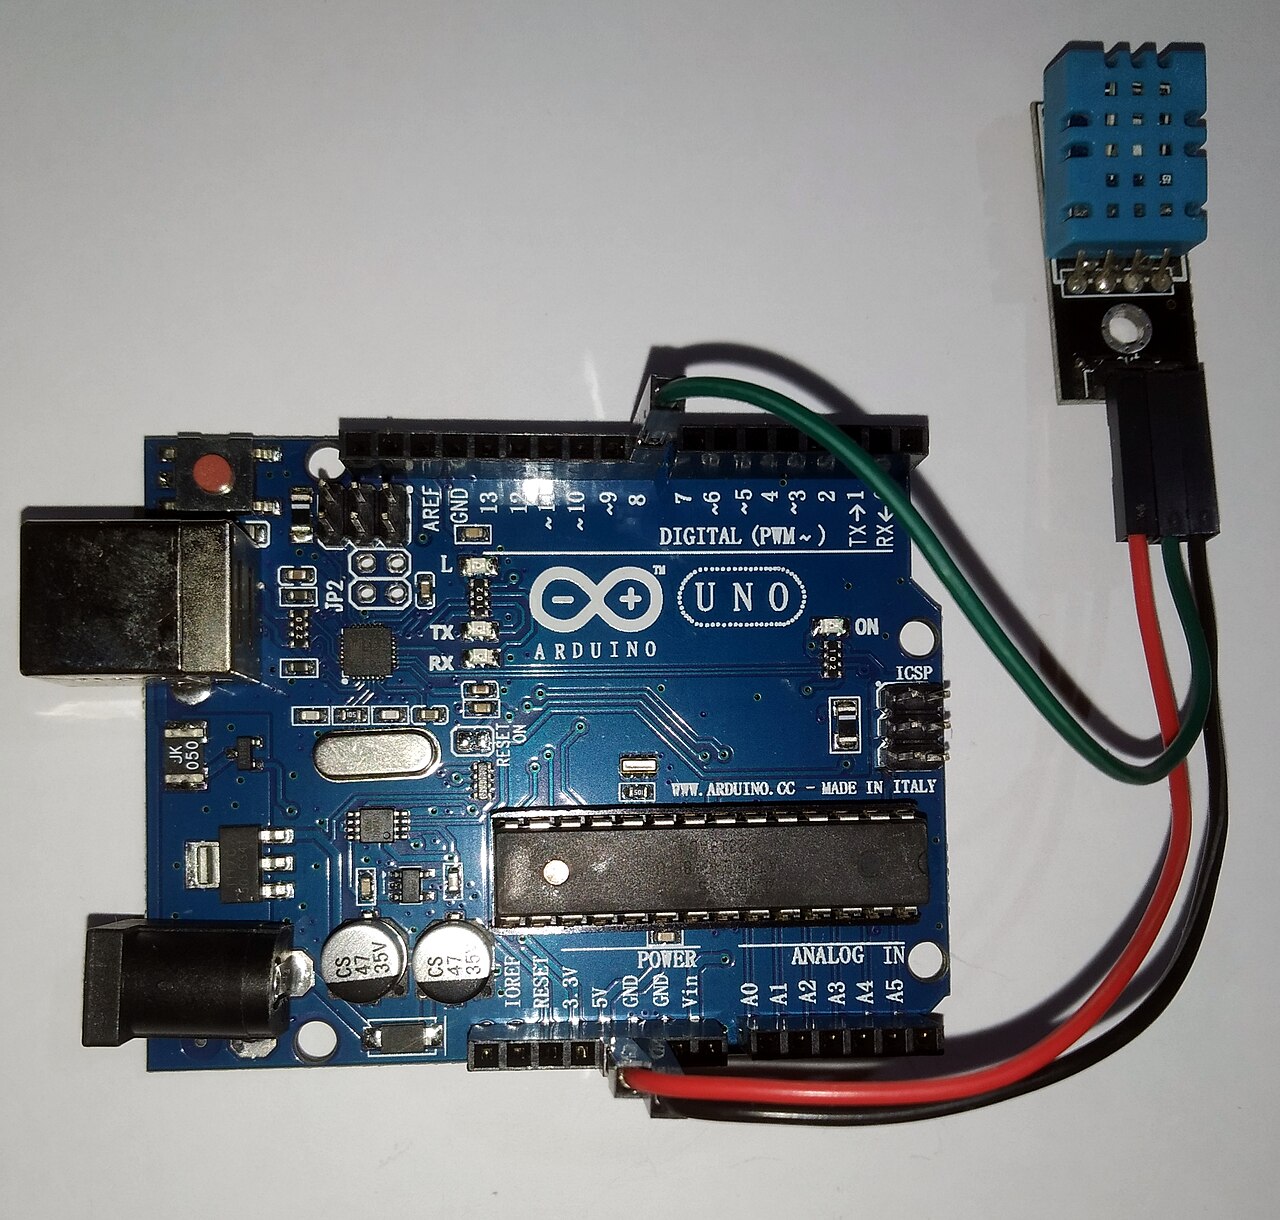
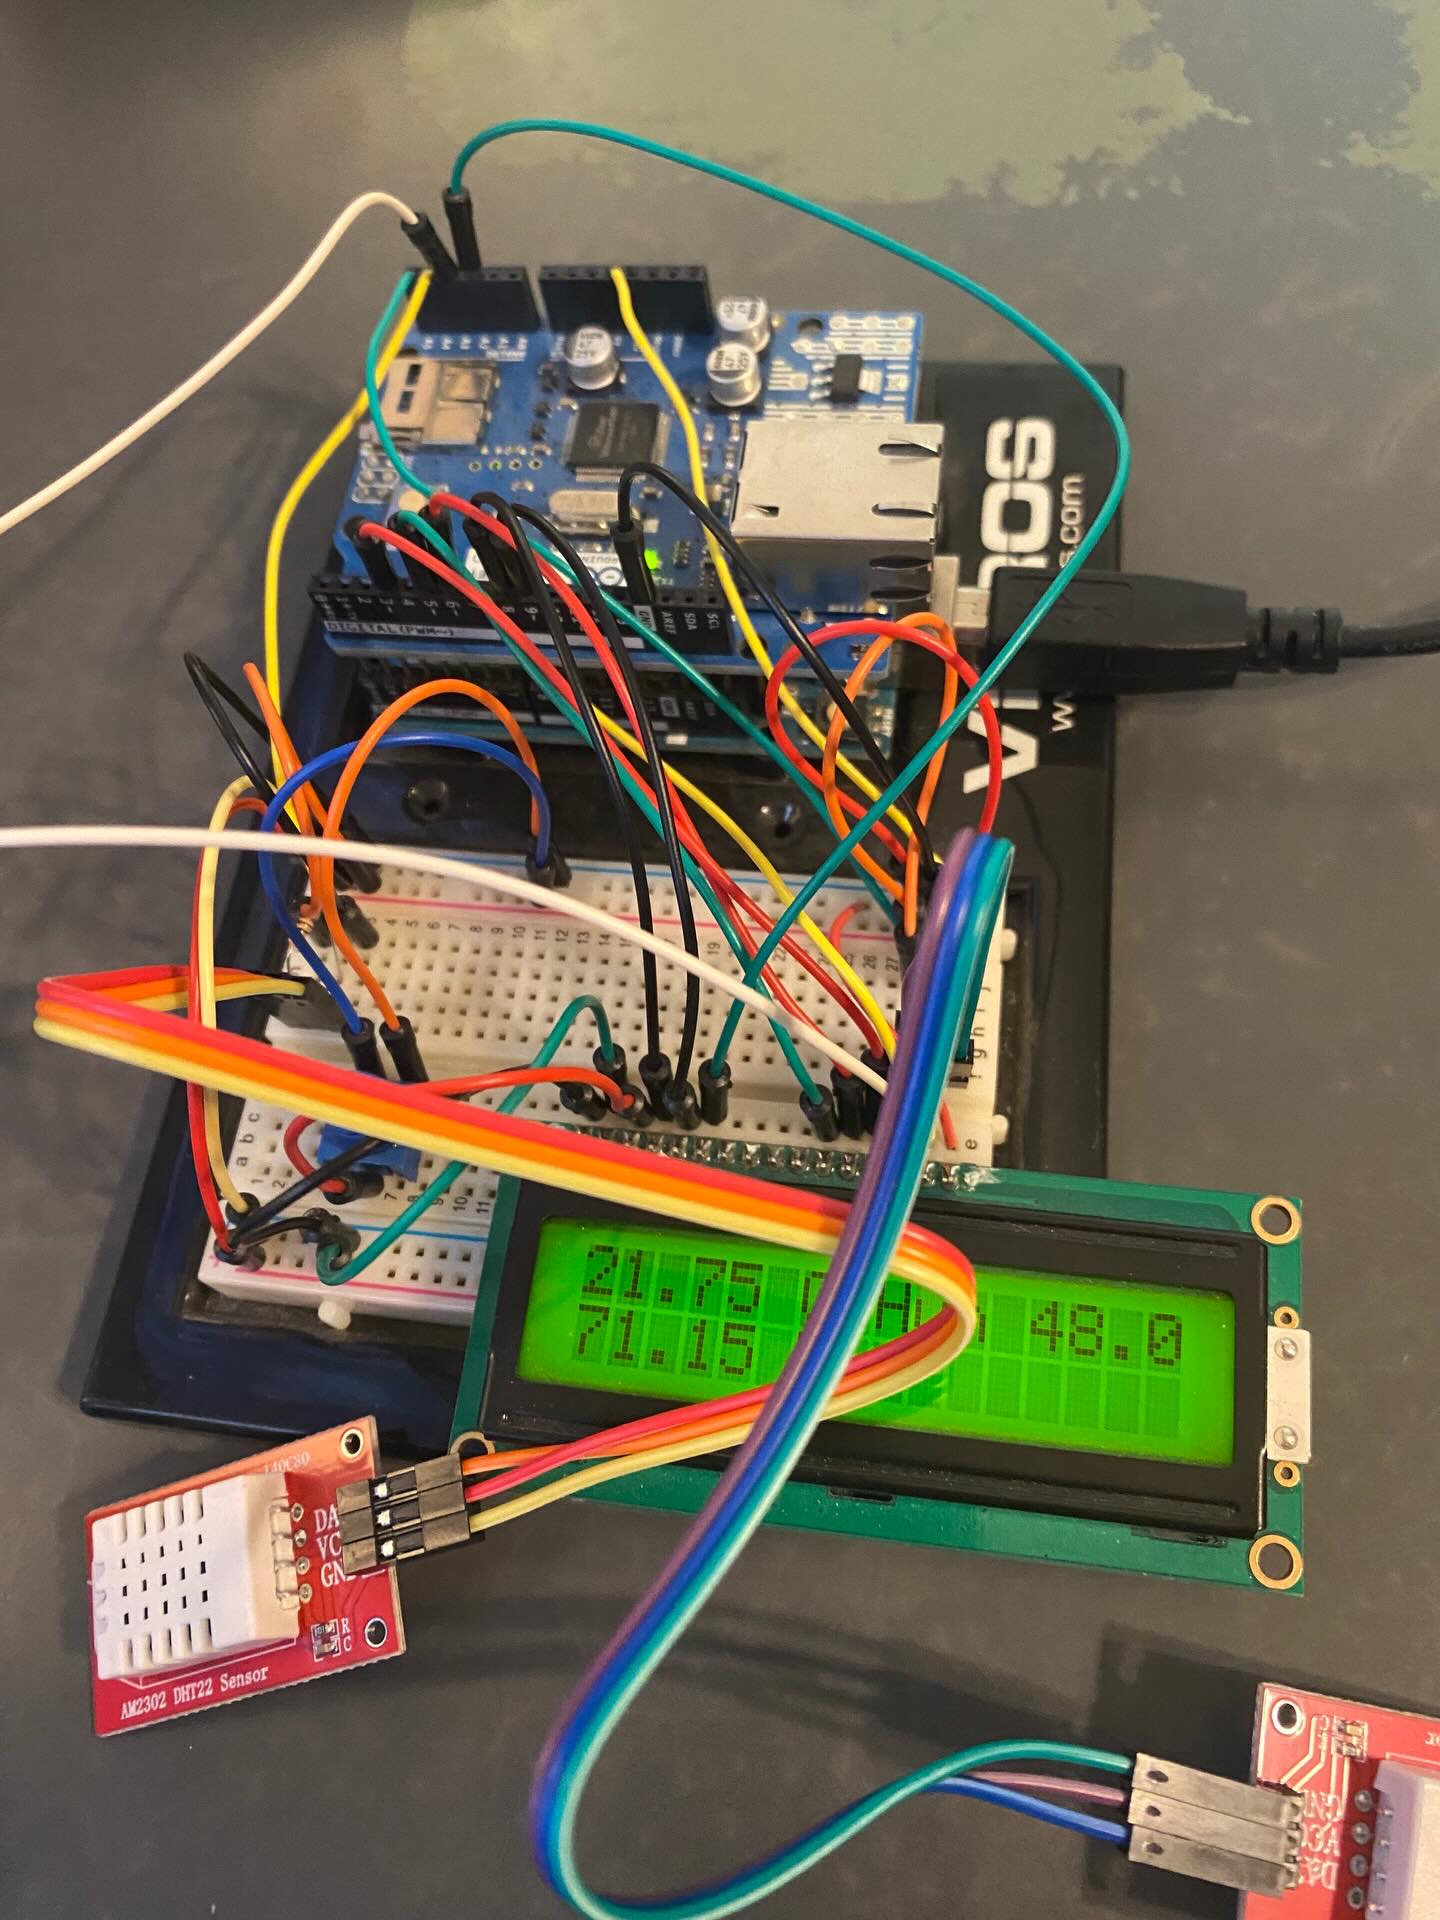
The physical build uses an Arduino Uno, W5100 Ethernet shield, breadboard, contrast potentiometer, 16×2 LCD, and two DHT22 sensors. Three companion pages document the schematics and pin map in detail:
Arduino circuit wiring overview
How USB power, the breadboard, contrast pot, LCD, sensors, and Ethernet shield fit together.
Arduino pin-level wiring
Pin-by-pin map matching the LiquidCrystal constructor and sensor data lines in firmware.
DHT22 sensors and LCD display
Why two probes show separate readings on the LCD while JSON feeds expose both to the website.
Network stack choices
This revision uses an Ethernet shield on SPI. The sketch handles DHCP, reconnect loops, and JSON
serving while the LCD continues to show live probe values. When TLS is too heavy for the MCU, a
Python relay can terminate HTTPS: see
Python scripts and feeds.
For push ingest from the same shield, see
ethernet_dht22_ingest.
Development workflow
Sketches are edited in the Arduino IDE or PlatformIO, flashed over USB, then verified with serial logging before the board is mounted in the monitored space. Confirm JSON shape with curl before adding the feed URL to the website dashboard.
Ready-to-adapt samples for DS18B20, MAX31855, MAX6675, and Uno + Ethernet live in this repo under sketches/. Raspberry Pi Pico W / Pico 2 W uses the same ingest JSON with CircuitPython or MicroPython. Full Ethernet + DHT + LCD firmware: arduino-network-json-temperature-sever.
Reliability tips
- Watchdog resets recover from rare network hangs without climbing a ladder.
- Separate sensor power noise from MCU power where long cable runs exist.
- Version your JSON schema in documentation when adding fields.
- Document which GPIO pins map to which physical probe labels, see the pin wiring guide.
FAQ
Where are sample Arduino sketches?
In the probeharbor GitHub repo under sketches/, plus the Arduino guides in About. ESP32 samples POST HTTPS directly. Uno + W5100 Ethernet uses ethernet_dht22_ingest (classic temp JSON on A4/A5) plus a LAN HTTP→HTTPS relay: the shield cannot TLS to probeharbor.dev.