

Stale readings mean the website shows an old temperature while the space has moved on, or shows nothing while the LCD still updates. Work from the sensor outward: hardware, JSON, cache, SSR fetch, then history.
Checklist
- curl the feed URL from outside your LAN: is JSON fresh?
- Compare LCD vs JSON, if LCD wins, fix relay or Redis TTL.
- Verify probe keys in dashboard match schema: probe mapping.
- Inspect Cloudflare / SSR logs for timeout patterns.
Hardware-side causes
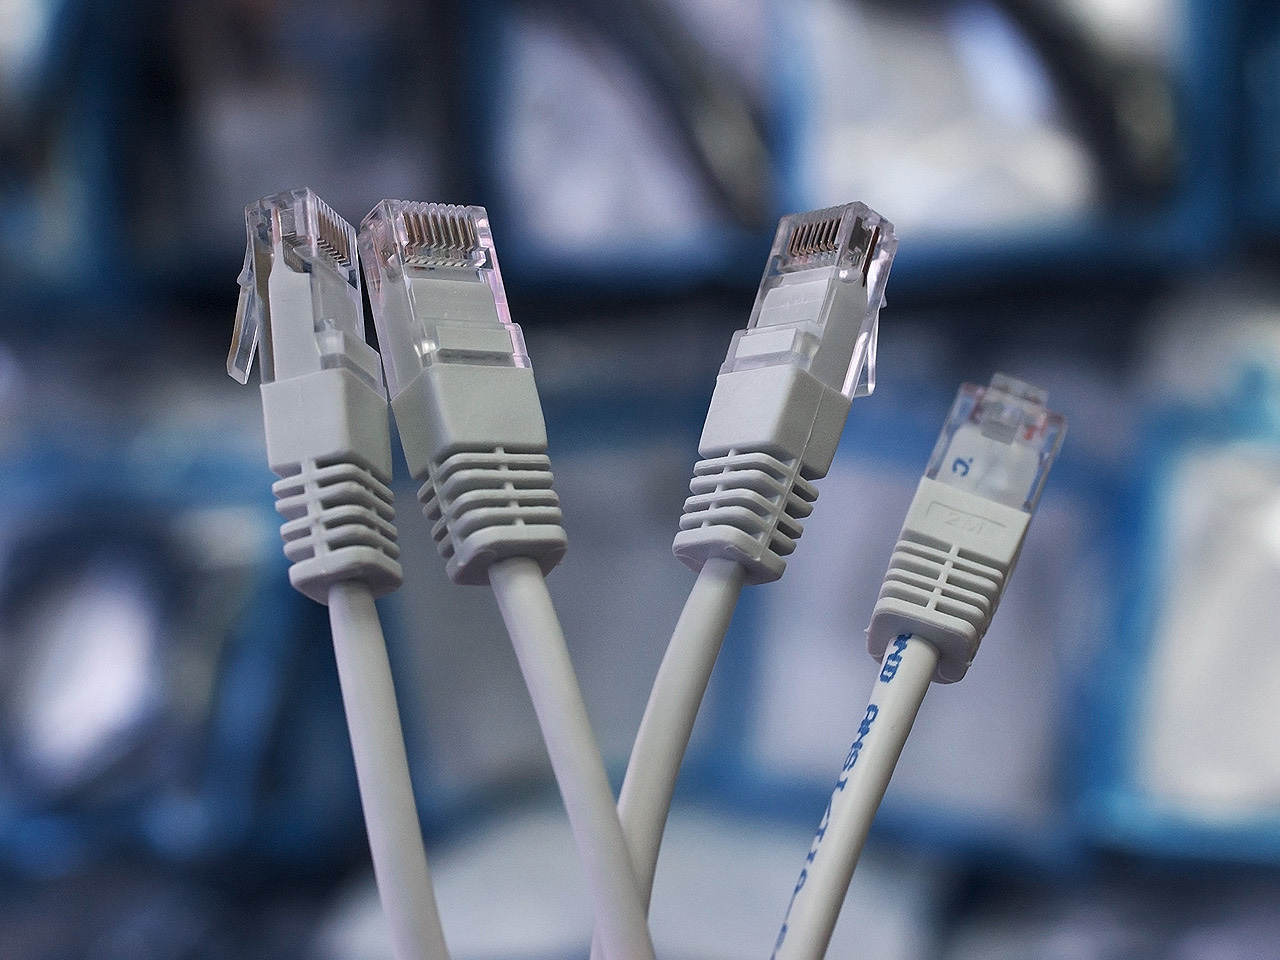
Watchdog reboots cause short gaps. DHT22 errors drop keys from JSON. Ethernet: wiring troubleshooting.
History vs live
Charts can lag if inserts stop but home page still looks live: check history inserts separately from home page fetch.
FAQ
Why are my probe readings stale?
Check device power and Wi‑Fi, verify the ingest key, confirm cron/history jobs on System status, and look for gaps in History before replacing sensors.