

Every number on the home page travels through several layers. Understanding that pipeline helps when debugging stale readings, missing probes, or history gaps.
Step 1. Sensing in the space
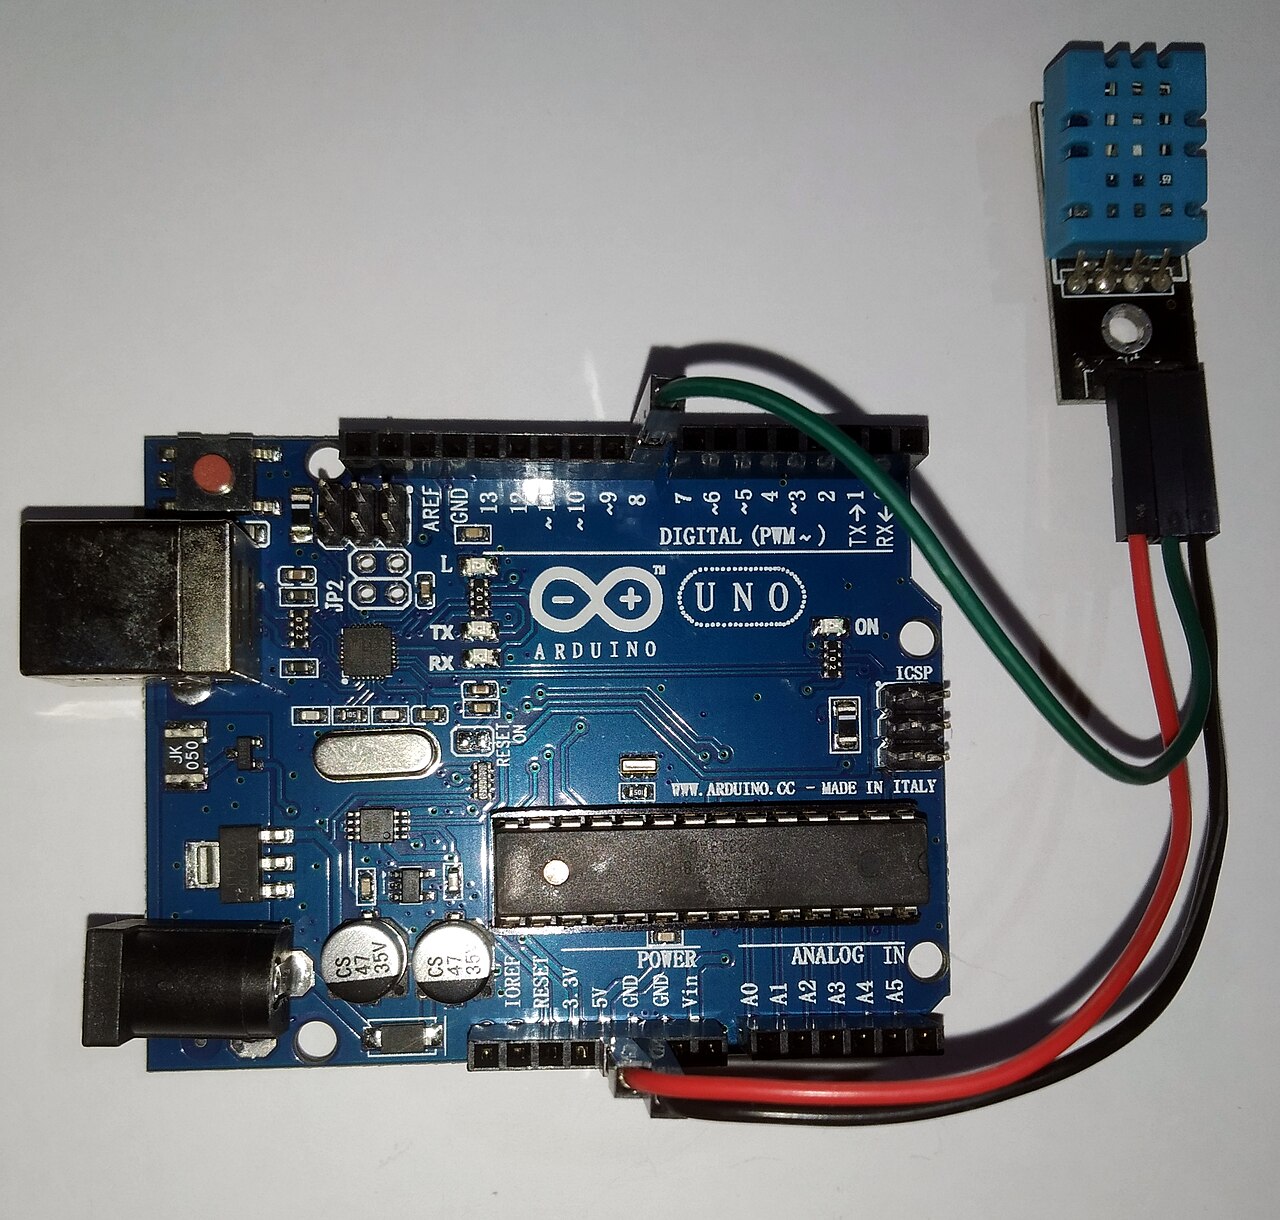
Probes measure temperature and humidity. The Arduino sketch polls them every few seconds, discards obvious outliers, and prepares an in-memory JSON structure. Details: Arduino sketches and temperature probes.
Step 2. Publishing JSON
The board or a nearby relay exposes HTTPS JSON. A Python FastAPI service may cache responses in Redis so the wider internet never hits the residential uplink directly: see Python scripts and feeds.
Step 3. Website fetch and display
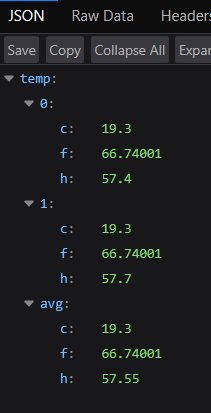
When you load the home page, server code retrieves each configured feed URL, parses probe keys, and renders stat cards. Signed-in users load feed and probe mappings from Supabase instead of defaults. Weather data follows a parallel path via OpenWeather using your optional city override.
Step 4. Persisting history
If you are authenticated, successful probe reads insert rows into Supabase with feed name, probe label, key, temperatures, humidity, and timestamp. Guests still see live data but do not append history. Learn more in historical data usage.
Step 5. Dashboard and export
The history table paginates those rows. CSV export streams the full set for admins and subscribers. Stripe webhooks maintain membership in the export-capable group. Account tools are described in accounts and dashboard.
Failure points to check
- Probe wiring or power: serial logs on the Arduino.
- Home network or certificate: curl the feed URL from a laptop on LTE.
- Relay cache stale: restart upstream pull in fast-api-relay.
- Dashboard mapping: probe key typos hide readings even when JSON is valid.
- Auth cookies: history saves only for signed-in sessions.
FAQ
How do readings reach the dashboard?
Devices push or feeds are pulled, readings land in storage, charts poll or stream updates, and alert jobs evaluate thresholds on a schedule.