

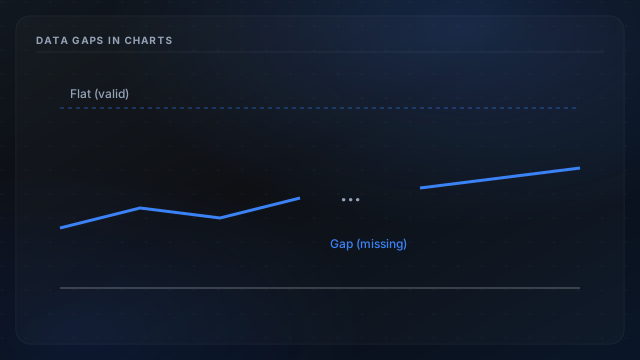
Saved history is only as complete as the polling pipeline. Power loss at the Arduino, relay downtime, auth misconfiguration, or Supabase insert failures all leave gaps. Learning to distinguish **missing data** from **flat temperature** prevents false confidence during cold snaps and billing disputes over CSV completeness.
Common gap causes
- Feed unreachable: relay down or IP change; start with stale reading debug.
- MCU reboot: short blank period after watchdog reset.
- Insert skipped: upstream fetch failed per history insert rules.
- Account/session: signed-out loads do not save; see session lifecycle.
Visual patterns
- Vertical whitespace in charts when time axis jumps forward.
- Repeated identical values can mean stuck cache: check feed caching.
- Single-zone flat while others move suggests mapping or sensor fault.
Workflow
Cross-check live JSON with curl, then browse history dashboard. Export via CSV subscription and filter timestamp column for discontinuities: techniques in spreadsheet charting.